06 // System Overview
How FieldSight AI works.
A subscription crop monitoring platform that combines satellite imagery, NDVI, water usage analysis, and AI-driven detection — so you catch problems early, cut input costs, and improve yields.
- 01
Farm Setup
Onboard in minutes and let the AI take over monitoring automatically.
- Sign up online or through a sales representative
- Upload or draw farm boundaries on a map
- Enter crop type and planting date
- AI begins monitoring the field automatically
- 02Professional Plan
NDVI & Water Usage Analysis
The platform generates NDVI imagery and water usage analysis across every field, annually.
- NDVI vegetation health mapping
- Water stress and usage tracking
- Zone-level trend detection
- 03
Satellite Monitoring
The platform analyzes satellite imagery to monitor crop conditions and detect changes over time.
Satellite passes give you coverage across the whole field, so nothing is missed between visits.
- 04
AI Analysis
The AI fuses imagery streams and surfaces what's changing across the field.
- Crop stress
- Water or irrigation issues
- Vegetation health decline
- Zone-level stress hot spots
- Poor emergence
- Growth inconsistencies
- Stand count variations
- Vegetation health trends (RGB)
- Historical changes over time
- 05
Instant Alerts
When an issue is detected, you're notified on your channel of choice — with the context to act.
- SMS text notification
- Email alert
- Dashboard notification
- Includes field location, severity, before/after imagery, and recommended next steps
- 06
Farmer Dashboard
One place to see every field, from any device.
- Interactive field maps
- Crop health scores
- AI-generated recommendations
- Historical trends
- Satellite imagery & NDVI layers
- Field reports & downloadable PDFs
- 07
Take Action
Instead of walking the whole farm, growers focus scouting on the specific areas the platform flags.
FieldSight AI prioritizes decisions — it doesn't replace agronomic judgment.
What actually shows up in your dashboard.
Every field gets an annual NDVI vegetation-health map and a water usage report — with flagged zones, year-over-year deltas, and dollar-value savings you can hand straight to your operator.
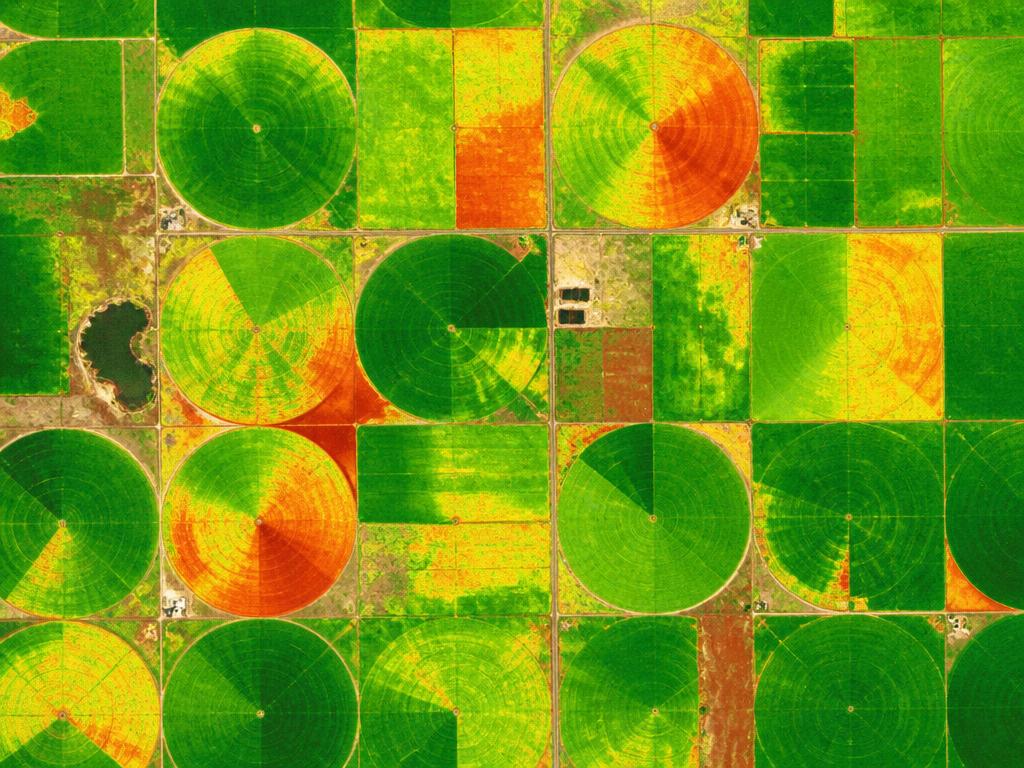
- Canopy vigor strong. 87% of acres above 0.65 NDVI — well within healthy range for stage.
- Zone B flagged (12.4 ac). NDVI dropped to 0.48 — likely irrigation shortfall on the SE quarter. Scout within 5 days.
- YoY improvement +9%. Field avg trending above last two seasons at same growth stage.
Next
Ready to see it on your fields?
Pick a plan or talk to us about a rollout tailored to your acreage.